Key Features
Cook & Associates
Management Consultants
Cook & Associates
Management Consultants
Key Features
Probably the best way to see why Cook & Associates and our PEP software are different is to examine the key features we use to help clients better manage people and process.
These six concepts provide the basic Cook & Associates framework for Effective Labor Management. They emphasize the need to design a practical program that will be accepted by the employees and useful to all management levels. In other words, the Program must really work !
Work Measurement
Work measurement is the nucleus that everything revolves around in a Labor Management Program. The work measurement concept can be divided into two topics:
WORK MEASUREMENT PHILOSOPHY: Ideally, measurement is by individual employee, or if not practical, by team or group. The type of measurement is based on how the work is performed and the availability of production data. In most PEP installations, 70% to 90% of measurement is individual.
The goal is to provide equitable measurement of all employees and work centers. A key to having a program that works is to avoid micro-managing. Although labor management software has the capability to monitor employees hour-by-hour, is this really a good long-term approach? It might work for a short period, but over a longer period it can become a major labor relations concern, and the maintenance burden is too high for the program to survive. In our projects, we get excellent results by using a more people-oriented approach that measures an employee's type and volume of work for an entire day and compares that to the hours paid. Our consultants are expert in balancing the level of detail: more is not necessarily better, and less is often not useful !
APPROACH TO SETTING TIME STANDARDS: Let's start by showing why time standards are even needed. The illustration below uses a tailor's job to show how time standards are used to convert production data into standard minutes of work and the eventual calculation of a Productivity Index (PI).
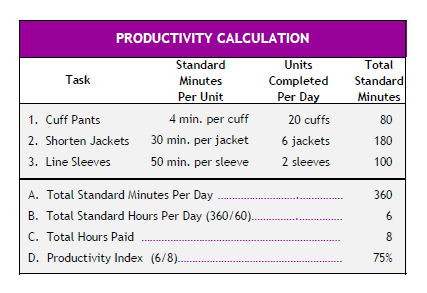
As can be seen in the example, the tailor performs three different tasks: Cuff Pants, Shorten Jackets, and Line Sleeves. By using time standards, the tailor's production is converted into six Standard Hours of work. Dividing this number by eight Paid Hours results in a Productivity Index of 75%.
Time standards can be set using a variety of techniques, such as: stop-watch studies, standard data, time logs, work sampling, video analysis, etc. Properly applied, any one of these techniques can normally be used to obtain acceptable time standards. The key is to make sure the standards are as simple as possible and accepted by all program participants, and that the standards maintenance will not outweigh the benefits of the program. The rule of thumb is the shorter the measurement period, the more detailed the standards. A realistic approach to setting and maintaining standards is a must if the program is to succeed. That's what we mean about being practical !
Employee Feedback
To have impact, the Labor Management Program must promote employee feedback between managers and their employees. In PEP, daily reports point out high and low performers. This allows immediate action to be taken to show appreciation to the high performers, and to help low performers improve. Two features that facilitate the required feedback are:
EMPLOYEE ON-SCREEN REVIEW: This daily network screen shows employees and managers how well they are performing and how the Productivity Index (%) is calculated. The screen clearly shows how work in multiple tasks is summarized by using engineered time standards. The resulting Total Standard Hours credited to the employee, divided by the employee's Total Available Hours to perform the work, produces an accurate Productivity Index.
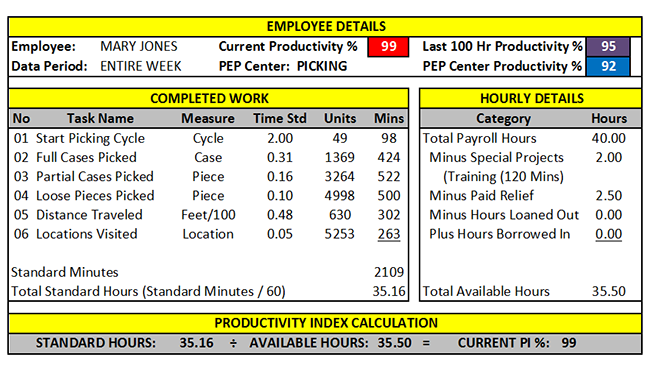
This illustration shows that Mary Jones had a very good week. Her Productivity Average was 99% for the week compared to her last 100 hours of work at 95%, and the work center average of 92%.
EMPLOYEE PERFORMANCE REVIEW: PEP also reviews all employees weekly and prints a graph for any employee whose last 100 hours of measured work falls below a minimum acceptable level. An integrated three-stage review system is included to track retraining efforts and monitor probation periods.
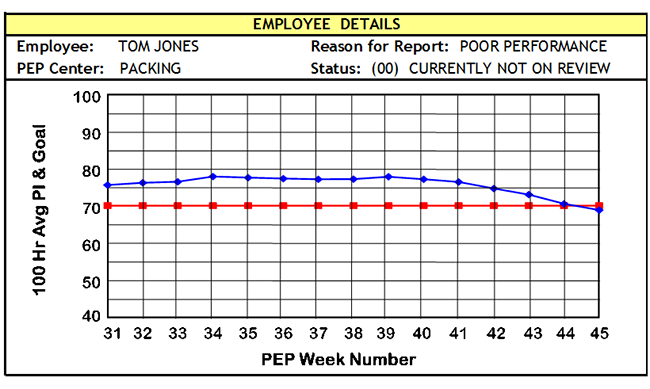
Tom Jones was an above average employee until Week 45. At that point this graph was generated. Now he would be put in the initial training stage — Status 01. The effectiveness of his training would automatically be monitored and, based on his results, he would either be put in the second training stage — Status 02, or in a probationary period.
Performance Quality
Employee Performance Quality is an important part of the overall PEP Program. Quality must be carefully monitored to establish and maintain high service standards. It's even more important if you're paying incentives. Obviously, you don't want to pay for poor quality work.
This was emphasized to Cook & Associates when a potential quality problem was brought to our attention in the early stages of our software development. One of our clients, an American multi-channel retailer, was concerned that since they started paying incentives, work quality might have gone down. Whether our client had a real or perceived difference in quality was immaterial. We realized they did not have the right tools in place to know the answer, and quickly remedied the situation by including a comprehensive Quality module in PEP.
Performance Quality is based on a 100% inspection process or on quality sampling procedures. Just as in work measurement, based on the availability of the data, quality statistics are by individual employee; if not, by team or group. The Quality results can also be automatically factored into incentive awards.
Employee Incentives
For many clients significant productivity and quality improvements can be achieved without employee wage incentives. However, if an organization chooses to pay for performance, even higher levels of productivity and quality can be reached and the benefits shared with the employees. Equitable incentives are the best way to keep your high-performing employees and to upgrade the overall quality of your staff.
If monetary incentives are not part of your program, some type of incentive should be developed to let your good employees know they are appreciated. Approximately 70% of our clients use weekly wage incentives. The biggest bang for the buck is individual employee incentives. Where individual incentives are not practical, team or group incentives can be used to be sure everyone participates in the Program; but make no mistake, incentives must be carefully controlled and, in PEP, we make sure you have the data to do this.
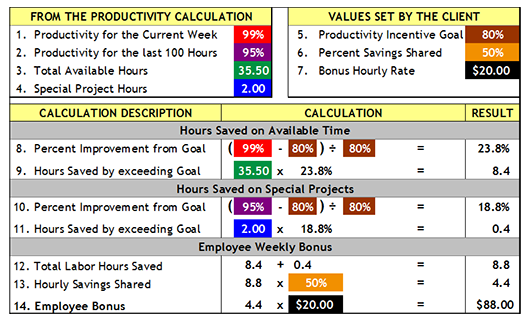
Incentives are based on sharing the labor hours that employees save the organization when they perform at a higher level than the pre-set goal. The Hours Saved calculation not only includes measured work, but also includes Special Projects (non-measured work) such as helping to train other employees. This illustration shows how incentives are calculated in PEP.
Using the productivity data for Mary Jones, this details how she saved the company 8.8 Labor Hours. This was shared 50% with Mary and resulted in a weekly Bonus Award of $88.
Staff Scheduling
If a Labor Management Program is to achieve the desired results, staff scheduling and the ability to flex staffs are an absolute necessity. There are several techniques to accomplish this balancing: cross-training and the sharing of employees among departments, part-time workers and agency employees, overtime and multi-shifts, reduced hours or layoffs, voluntary time off, and the assignment of special projects.
PEP uses simulation and feedback technology to perform the numerous calculations needed to generate accurate schedules. The Program handles the variations in daily and weekly workloads, and creates the complicated internal network among operating areas. This results in schedules that show the number of employees required in each work center, whether work centers need to loan or borrow employees from the existing staff, and finally whether overtime, temps, or layoffs are required. Once schedules have been generated, PEP automatically monitors their accuracy and the actual performance against scheduled. In other words, what good is a neatly prepared schedule if it is not accurate, or managers do not respond to the information?
Sometimes, adhering to the schedule can be a challenge. Either the staffing requirements are difficult to achieve in a short period of time, or there are significant financial constraints. We attended a scheduling meeting for a Canadian fashion retailer. One of the supervisors presented an interesting situation: Suppose the budget would be exceeded if she used the labor called for in the schedule. Should she stay within budget constraints, or meet the company's timeliness goals? In this case, our client's management team placed a priority on getting the merchandise out on time, and authorized the labor called for in the schedule. What would you have said — service or budget? In either case, PEP gives you the information you need to make an informative decision.
Data Summarization
Up to this point, the focus has been on managing people. Data Summarization now focuses on managing the process. This is accomplished in PEP by compiling meaningful data for all levels of management in a standardized reporting format. This means that all managers, from the Receiving Manager on the dock to the Corporate Vice President of Logistics, have customized reports with the data they need to take action. The reports are all in one of the selected PEP standard formats so that as managers progress up the chain of command, they will totally understand the reporting metrics. This is primarily accomplished through the following reports:
DAILY FLASH: This report automatically summarizes information for each level of management. This report is produced daily as work progresses through the week, and is customized to contain key statistics that evaluate operating effectiveness. This sample report shows a partial Daily Flash for a picking operation.
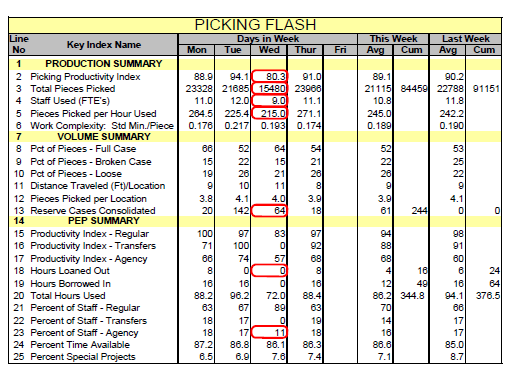
Take a look at the illustration and analyze some of the results. Focus on the data circled in red for Wednesday. As you can see, the Wednesday Picking Productivity Index (line 2) and Pieces Picked per Hour (line 5) are appreciably lower than the other four days in the week. You can also see (line 3) that Wednesday had the lowest volume.
Has the picking manager taken effective action to balance the staff with the reduced volume? Line 4 shows that the staff was reduced from the other four days; however, the low Productivity Index indicates that it has not been reduced enough. Could the manager have done more Stock Consolidation (line 13)? Could the manager have Loaned Hours to some other areas (line 18)? And why is the manager still using Agency Staff (line 23)? This is one example of how the Daily Flash can be used to evaluate managerial and process effectiveness.
WEEKLY HISTORICAL PROFILE: This report automatically summarizes information for the current week and makes historical comparisons. As in the Daily Flash, the data includes key metrics that show the true operating picture for each department, building, and the entire logistics network. In addition to the data shown on the Daily Flash, the Profile normally contains Labor Costs, Incentive Statistics, Quality Control Results, and Staff Scheduling Data. The following shows an excerpt from an actual distribution center Profile report.
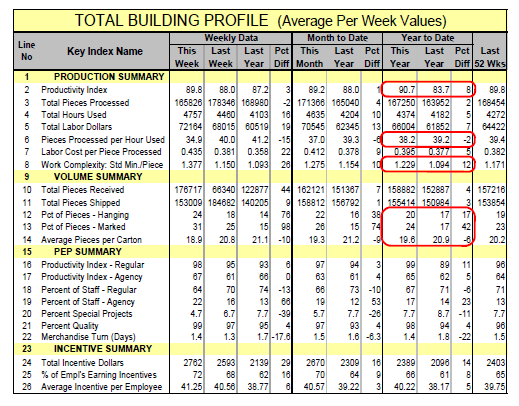
Take a look at the illustration to analyze some of the building's results. Let's focus on the Year-to-Date data circled in red. The results show an anomaly. The Productivity Index (line 2) has increased 8% over the previous year, but the Pieces Processed per Hour (line 6) has decreased 2%. Why? Lines 8, 12, 13, and 14 provide a hint as to why this situation occurred. The key is line 8 which shows Work Complexity increased 12%. In other words, even though the staff operated more efficiently, the amount of work required for each piece processed was greater than the previous year. Line 12 shows that Processing Hanging Merchandise (normally more time-consuming than Flat Merchandise) increased 17% over the previous year. In addition, line 13 shows that the number of pieces that had to be Marked increased 42%. Also, the Average Pieces per Carton (line 14) decreased 6%.
Analyzing results like these is a fundamental part of managing the process. Should the Distribution Center be redesigned to handle more hanging merchandise? Should marking methods be made more efficient, or does the merchandise purchasing program not highlight the need for pre-marked merchandise? Should the sortation process be re-tuned for fewer pieces per carton? This example shows one of the ways that the Profile Report can be used for both short and long-term planning and improvement.